Periodic indices
UK local solar deployment index
Short answer
This dataset compares 362 UK local-authority areas using DESNZ's 2024 solar PV site, capacity, generation and household data. It measures PV sites per 1,000 estimated households; it is deployment density, not installer availability or rooftop-only uptake.
- Council areas
- 362
- Data year
- 2024
- Published source
- 30 Sep 2025
- Licence
- CC BY 4.0
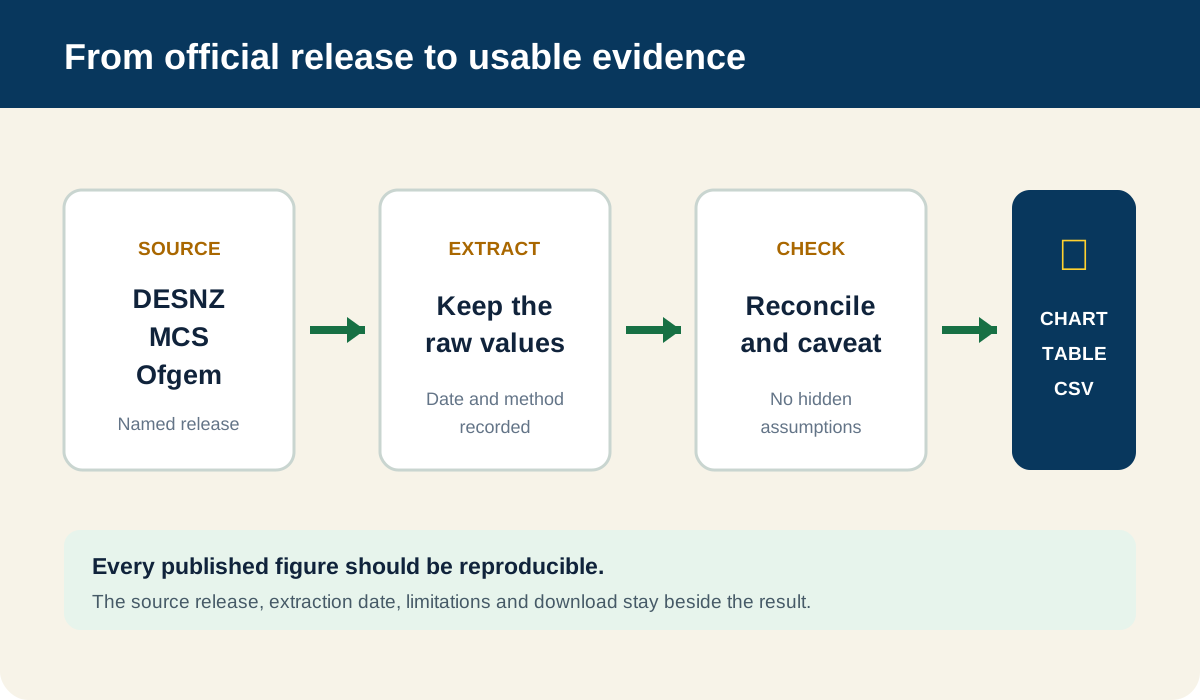
Download all 362 local-authority records. Every row carries the council code, source release and extraction date.
What this index measures
The ranking divides DESNZ’s number of photovoltaic sites by its estimated household count, then multiplies by 1,000. It makes differently sized areas comparable. It is not the percentage of homes with panels because the numerator includes non-domestic and utility PV.
Highest site densities in the 2024 table
| Local authority | PV sites | Households | Sites per 1,000 | PV capacity | |---|---:|---:|---:|---:| | Stirling | 8,003 | 41,103 | 194.71 | 25.900 MW | | Isle of Anglesey / Ynys Môn | 5,676 | 30,800 | 184.29 | 101.755 MW | | South Hams | 7,052 | 39,300 | 179.44 | 142.493 MW |
This is not a league table of “best places for home solar.” A council with a large solar farm can have high capacity without unusually high household uptake; a dense city can have fewer suitable roofs per household. The value is in combining fields, not treating one column as a verdict.
Methodology
- Download the Renewable electricity by local authority, 2014 to 2024 workbook published on 30 September 2025.
- Select the 2024
Sites,CapacityandGenerationworksheets. - Join rows using official local-authority codes, not text-matched names.
- Calculate
sites ÷ estimated households × 1,000. - Preserve suppressed generation as blank with
generation_suppressed=true; never convert a suppressed value to zero. - Retain the raw components and sort the download by calculated density.
Limitations
- The latest local-authority release covers 2024; this is not a live counter.
- Boundaries can change, so use the code and release year when joining another dataset.
- Site counts cover the full PV range and are not limited to homes.
- Estimated households are a denominator, not proof a site belongs to a household.
- DESNZ suppresses some generation to avoid revealing an individual plant.
Change history and reuse
- 29 August 2026: first release, 362 rows from the September 2025 workbook.
Reuse the transformation under CC BY 4.0 with attribution and a link. The underlying DESNZ data is under the Open Government Licence. For corrections, contact us.
Common questions
Does one solar site equal one household?
Is this an installer density ranking?
Why can high generation coexist with modest site density?
Sources
Checked 2026-09-02. Rates, rules and eligibility can change. Confirm current terms before signing a contract or applying for funding.
Work out the number before anyone quotes you
Every assumption editable, nothing sent anywhere, no email. It will not give you a quote, but it will tell you whether one is fair.
We are not taking quote requests yet
We will not collect your details until we can name the installers who would receive them, so there is no form here to fill in. What we can do is tell you when something changes: a scheme opening, an export rate moving, or the quote form going live.