Live trackers
UK solar data briefing
Short answer
UKSolars publishes reusable UK solar datasets built from DESNZ statistics and current supplier tariff pages. Journalists, councils and publishers may quote the findings and reuse the CSV files under CC BY 4.0 with a link to the relevant dataset page.
- Regional cost records
- 256,777
- Council areas
- 362
- SEG rows checked
- 16
- Licence
- CC BY 4.0
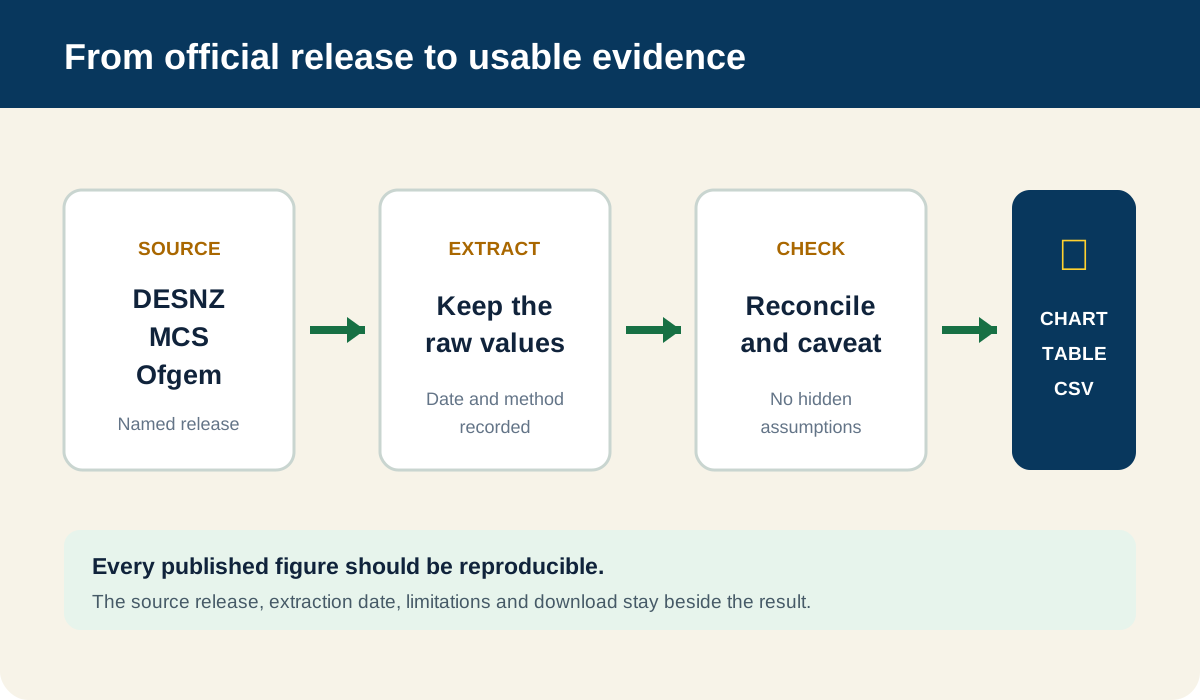
These figures are prepared for people who need a number they can reproduce, not a promotional claim. Each finding links to the full table, source release, method and limitations.
Three findings ready to quote
- Regional installation costs differed by £253.09/kW in 2025/26. In the latest DESNZ regional table, the mean for systems below 50kW ranged from £1,645.83/kW in Wales to £1,898.92/kW in London. This is a statistical benchmark, not a quote for a home.
- Local deployment density varies sharply. In DESNZ’s 2024 table, Stirling recorded 194.71 PV sites per 1,000 estimated households. The numerator includes domestic and non-domestic sites, so this is not the percentage of homes with solar.
- The highest export rate is not the widely available rate. On 1 September 2026, the highest verified flat SEG rate in our table was 25p/kWh, but it required the supplier’s import tariff and an eligible supplier-installed solar-plus-battery system. The highest verified untied flat rate was 6p/kWh.
Downloads
Correct attribution
Use: “Analysis by UKSolars, based on [named source]” and link to the dataset page, not only the CSV. The page carries the definitions that prevent a number being misrepresented.
Editorial notes
- Great Britain and United Kingdom are not interchangeable in energy data. Each dataset says which geography it covers.
- A photovoltaic “site” is not necessarily a home.
- A mean cost per kW is not a market quote or a forecast.
- A conditional export rate must not be presented as available to every solar owner.
For a correction or a supported custom cut, use the media, research or data route on the contact page.
Common questions
Can these figures be quoted in an article?
Can UKSolars provide a regional or supplier-specific cut?
Are these installation quotes or forecasts?
Sources
Checked 2026-09-02. Rates, rules and eligibility can change. Confirm current terms before signing a contract or applying for funding.
Get important solar updates
One email when a grant, export rate or rule changes. No newsletters or sales emails.