Periodic indices
UK Solar Cost Index 2026
Short answer
In DESNZ's 2025/26 MCS-derived data, the mean installed cost across systems below 50 kW ranged from £1,645.83 per kW in Wales to £1,898.92 per kW in London. These are regional means on a Total Installed Capacity basis, not quotes for a particular home.
- Latest period
- 2025/26
- Records analysed
- 256,777 regional records
- Regional range
- £1,646–£1,899/kW
- Licence
- CC BY 4.0
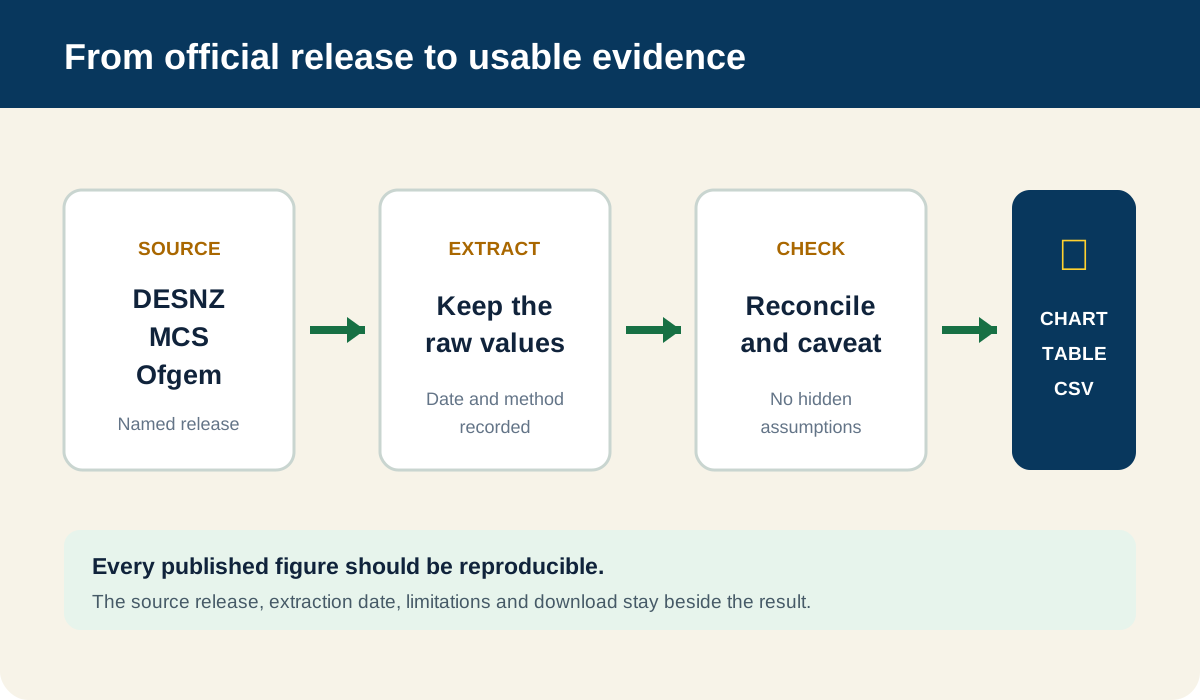
This index is a cleaned, citable version of the official regional table—not a survey of advertised prices. Download the complete CSV or use the table below for the latest financial year.
2025/26 regional cost per kW
| Region | All systems mean | Under 4 kW mean | Records | Coverage | |---|---:|---:|---:|---:| | London | £1,898.92 | £2,101.01 | 7,998 | 92.25% | | South East | £1,766.36 | £1,858.90 | 36,678 | 95.96% | | East Midlands | £1,744.14 | £1,839.81 | 24,687 | 98.68% | | South West | £1,739.28 | £1,887.23 | 30,971 | 98.27% | | North West | £1,714.03 | £1,799.83 | 22,983 | 96.38% | | Yorkshire and The Humber | £1,709.04 | £1,800.21 | 18,824 | 97.39% | | East of England | £1,708.36 | £1,795.76 | 28,708 | 96.61% | | West Midlands | £1,699.91 | £1,778.37 | 21,961 | 98.21% | | North East | £1,696.22 | £1,760.41 | 13,283 | 97.69% | | Scotland | £1,692.49 | £1,766.90 | 28,224 | 96.74% | | Wales | £1,645.83 | £1,838.00 | 22,460 | 97.48% |
Read the basis before comparing prices
These figures use Total Installed Capacity (TIC). DESNZ warns that TIC is usually higher than Declared Net Capacity, so a cost per kW calculated on TIC is normally lower. Do not mix this table with older DNC-based series without stating the change.
What is included
DESNZ describes the recorded cost as solar generation equipment, installation, connection to the electricity supply and VAT where applicable. Batteries are excluded. The release covers small-scale installations in Great Britain; Northern Ireland is not included. It is labelled “official statistics in development,” so its method and historic figures may be revised in later releases.
Methodology
- We downloaded the DESNZ Solar Costs 2025/26 (TIC) workbook released 28 May 2026.
- We extracted the
Regional costs (TIC)table without changing its values. - We retained year, region, sample, exclusions, coverage, overall mean and capacity bands.
- We rounded displayed currency to two decimals. Every CSV row identifies its source and extraction date.
- We checked that the latest regional sample totals 256,777 records. We do not create a national mean by averaging regional means because that would be methodologically wrong.
Interpreting the figures
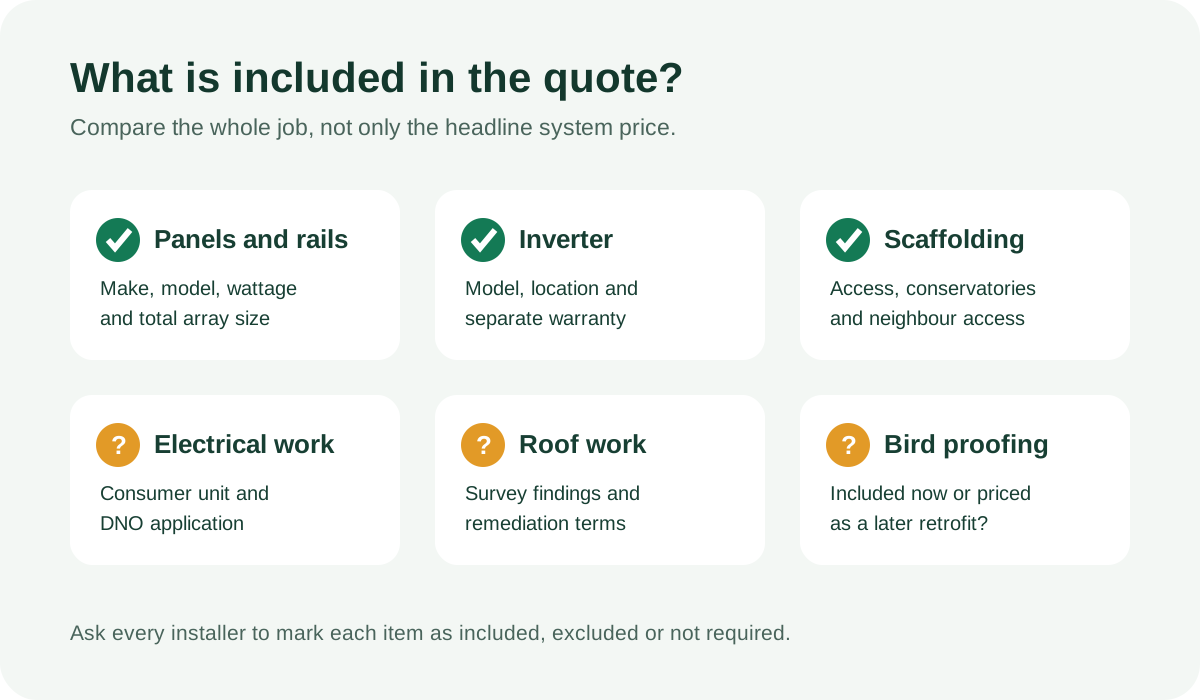
London has the highest latest regional mean in this release and Wales the lowest. That does not prove geography alone caused the difference. System-size mix, property type, new-build share and job complexity can differ. Treat this as a quote benchmark: if a proposal is far above it, ask which extra work explains the gap; if it is far below, check equipment, warranties, scaffolding and exclusions.
Change history and reuse
- 29 August 2026: first release; 33 region-year rows covering 2023/24 to 2025/26.
The transformed CSV is free to reuse under CC BY 4.0 with credit and a link. The source data is Crown copyright under the Open Government Licence. We publish dated corrections rather than silently replacing values. Report an issue through contact.
Common questions
What does the solar cost per kW include?
Is this the price my system will cost?
Why does this use mean rather than median regional prices?
Can I reuse the data?
Sources
Checked 2026-09-02. Rates, rules and eligibility can change. Confirm current terms before signing a contract or applying for funding.
Work out the number before anyone quotes you
Every assumption editable, nothing sent anywhere, no email. It will not give you a quote, but it will tell you whether one is fair.
We are not taking quote requests yet
We will not collect your details until we can name the installers who would receive them, so there is no form here to fill in. What we can do is tell you when something changes: a scheme opening, an export rate moving, or the quote form going live.